Explainer
How much unemployment will I get? State formulas and EI
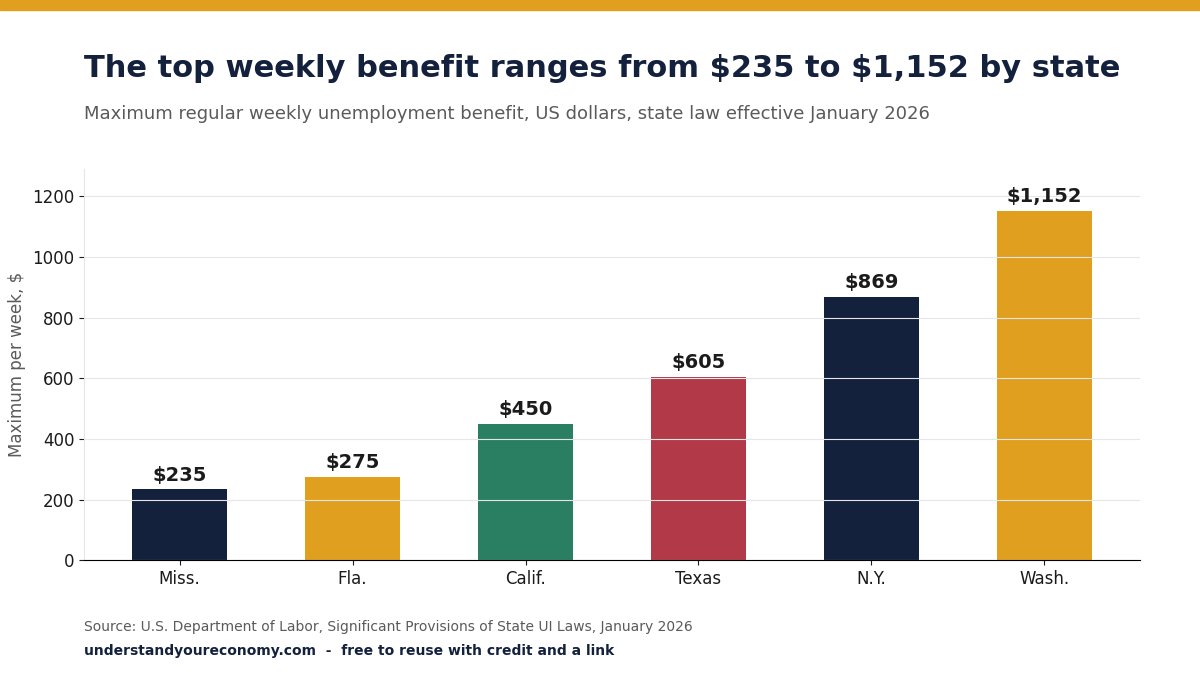
- How much unemployment you will get depends on your state: in state law effective January 2026, the top weekly benefit ran from $235 in Mississippi to $1,152 in Washington, according to the U.S. Department of Labor.
- The average weekly benefit paid across the US in April to June 2026 was $500.61, according to Labor Department data.
- Canada's EI pays 55% of average insurable weekly earnings, up to C$729 a week in 2026, according to the Government of Canada.
How much unemployment will you get? Usually about half of your past weekly pay, up to your state's maximum. In state law effective January 2026, those maximums ran from $235 a week in Mississippi to $1,152 in Washington, according to the U.S. Department of Labor. The US average paid in April to June 2026 was $500.61 a week, according to Labor Department data. Here is how unemployment works from start to finish.
How is the weekly unemployment benefit calculated?
Each state uses your wages from the base period, usually the first four of the last five finished calendar quarters, and runs them through its own formula, according to the Department of Labor. The formulas differ, but most aim at roughly half of what you used to earn in a week, then stop at a maximum. The Labor Department's comparison of state laws, effective January 2026, shows four common types:
| State | Formula | Weekly range, January 2026 |
|---|---|---|
| Florida | 1/26 of wages in your best quarter | $32 to $275 |
| Mississippi | 1/26 of wages in your best quarter | $30 to $235 |
| Washington | 3.85% of the average of your two best quarters | $366 to $1,152 |
| Massachusetts | 50% of your average weekly wage, plus $25 per dependent | Up to $1,105, plus dependents |
| California | Set by state law | $40 to $450 |
| New York | Set by state law | $140 to $869 |
| Texas | Set by state law | $75 to $605 |
Sources: U.S. Department of Labor, Significant Provisions of State UI Laws, January 2026. Massachusetts places no cap on the dependents' allowance.
Your best quarter is the three-month block in which you earned the most. Using quarters is why a recent raise may not show up in your benefit yet.
How much unemployment will I get if I make $1,000 a week?
Between $235 and about $525 a week in the four formula states above, under state laws effective January 2026 compiled by the US Labor Department. The worked example uses the same pay in each.
The formulas are from the Labor Department's January 2026 comparison and the Government of Canada. The same paycheck buys very different help: the Washington worker gets more than twice the Mississippi worker's benefit.
Do you need to earn a minimum to qualify?
Yes. Every state sets a floor on base-period wages. In Florida, for example, you need wages in at least two quarters, at least $3,400 in total, and total base-period wages of at least 1.5 times your best quarter, according to the Labor Department. A worker whose best quarter was $3,000 would need $4,500 across the base period. In Canada the floor is counted in hours: 420 to 700 insured hours in the last 52 weeks in 2026, depending on the local unemployment rate, according to the Government of Canada.
What do people actually get?
Less than the maximum, in most cases. In April to June 2026 the average weekly benefit was $500.61 across the US, according to Labor Department data. The table compares each state's legal top with what it actually paid on average.
| Where | Maximum (January 2026) | Average paid (April to June 2026) |
|---|---|---|
| Mississippi | $235 | $224.16 |
| Florida | $275 | $267.08 |
| Massachusetts | $1,105 plus dependents | $732.21 |
| Washington | $1,152 | $776.80 |
| United States | Varies by state | $500.61 |
| Canada (EI) | C$729 (2026) | Not published on the same basis |
Sources: U.S. Department of Labor, Significant Provisions of State UI Laws, January 2026, UI Data Summary, 2nd quarter 2026, Government of Canada, EI benefit amount.
In the low-cap states, the average sits just under the maximum, which suggests many claimants there are paid the maximum. In Washington, the average was 32.6% below the maximum in April to June 2026, by our calculation from the same Labor Department data.
How much EI will I get in Canada?
55% of your average insurable weekly earnings, up to C$729 a week in 2026. The average is taken over your best 14 to 22 weeks, depending on the unemployment rate in your region, and the rate stays fixed for the whole claim, according to the Government of Canada. Insurable earnings stop counting at C$68,900 a year in 2026, so anyone earning more than that gets the same maximum.
You can also work part time while on EI. Each dollar you earn cuts your EI by 50 cents, up to earnings of 90% of your old weekly pay, according to the Government of Canada. Its own example: with a C$275 weekly benefit and C$300 earned in a week, C$150 is taken off, leaving C$125 of EI and C$425 in total.
What this means for you
- Higher earners replace a smaller share of pay. Once your wages pass your state's cap, every extra dollar you used to earn adds nothing to the benefit.
- Your state matters more than your salary. Under January 2026 state laws, the same $1,000 a week leads to $235 in Mississippi and $500.50 in Washington (Labor Department).
- The benefit is taxable. See whether unemployment is taxable before you plan a budget around it.
- Check how long it lasts too. A high weekly amount for a few weeks can total less than a lower one for longer; our page on how long unemployment lasts compares the states.
How we got these numbers
Most figures on this page are published as-is by the agencies linked next to them. These ones are our own calculations from official data, so you can check them:
- $500 a week under the 1/26 formula, before the capFlorida and Mississippi pay 1/26 of the wages earned in the best quarter of the base period (U.S. Department of Labor, state laws effective January 2026). $13,000 ÷ 26 = $500 a week, which both states then cut to their maximums of $275 and $235.
We do not adjust the official data, and we make no forecasts of our own.
You are welcome to quote these numbers and charts. Please credit Understand Your Economy and link to this page.
Update log
- : Page created with state laws effective January 2026 and Labor Department benefit data for April to June 2026.
Have a question about this article?
Ask us privately. We read every question, reply by email, and the best ones become new answers on the site.
Ask a questionResearched from the official sources linked in this article, drafted and fact-checked by the Understand Your Economy editorial team on October 31, 2026.
This article is general educational information, not personalised financial, investment, tax or legal advice. Consider speaking with a qualified professional about your own situation.
No paid links in this article.
Spotted an error? Tell us and we will correct it.