Live data · updated monthly
Inflation calculator: US and Canadian dollars over time
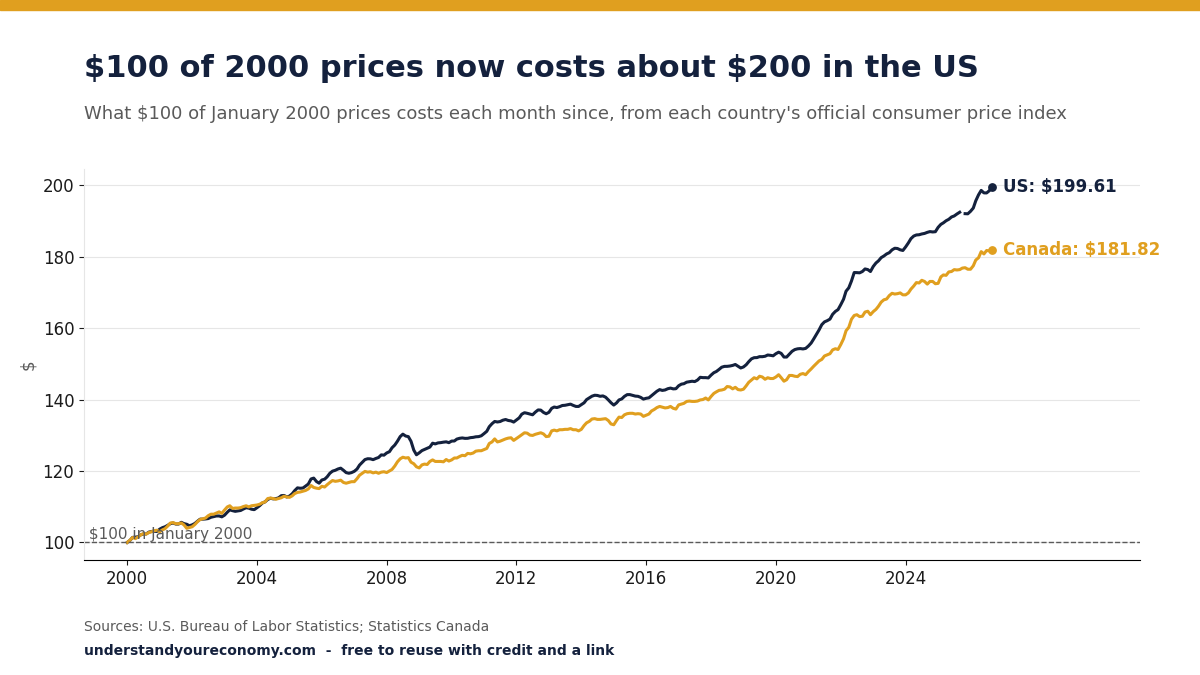
This inflation calculator shows what an amount of money from one month is worth in another, using the official consumer price index (the government's monthly measure of what a typical basket of goods costs) for the United States or Canada. In the US, $100 in January 2000 had the same buying power as $199.61 in September 2026, based on the U.S. Bureau of Labor Statistics price index. Pick a country, an amount and two months below.
The calculator needs JavaScript in your browser. The table of examples further down this page shows the same calculation for common years.
How does the inflation calculator work?
A price index tracks what the same basket of goods and services costs each month. To move an amount from one month to another, the calculator multiplies it by the later month's index. Then it divides by the earlier month's index. In the US the index was 336.94 in September 2026 and 168.8 in January 2000, according to the Bureau of Labor Statistics, so prices rose 99.6% between those months.
For the US we use the same series as the BLS CPI Inflation Calculator: prices paid by urban consumers, all items, not seasonally adjusted (raw monthly prices, with no smoothing for regular seasonal swings). It goes back to 1913. For Canada we use the all-items consumer price index from Statistics Canada. It goes back to 1914. The Bank of Canada's inflation calculator uses the same data. The two countries' indexes start from different base years, so we only ever compare months within one country.
The US has no figure for October 2025, because the Bureau of Labor Statistics could not collect that month's price data during a lapse in government funding. The calculator tells you if you pick that month.
How much is $100 from a past year worth today?
| $100 in January of | United States (September 2026) | Canada (September 2026) |
|---|---|---|
| 1950 | $1,433.79 | $1,404.96 |
| 1970 | $891.38 | $841.58 |
| 1980 | $433.08 | $406.70 |
| 1990 | $264.47 | $221.64 |
| 2000 | $199.61 | $181.82 |
| 2010 | $155.50 | $147.70 |
| 2020 | $130.61 | $124.27 |
Sources: calculated from the U.S. Bureau of Labor Statistics consumer price index and the Statistics Canada consumer price index table, checked November 9, 2026. Source: Statistics Canada, Table 18-10-0004-01, September 2026. Reproduced and distributed on an 'as is' basis with the permission of Statistics Canada.
Each country's amount uses only its own prices: a US dollar in the US column, a Canadian dollar in the Canada column. For any other year or month, use the inflation calculator above.
What changed this release
The calculator now runs to September 2026 for the US and to September 2026 for Canada. The US figure for October is due on November 10, 2026, and Canada's October figure on November 16, 2026, according to the Statistics Canada release calendar and the BLS release schedule. Read the latest US and Canada inflation rate for what moved prices this month.
Why your own costs may differ
The index is an average for the whole basket: food, shelter, furniture, clothing, transportation and recreation, as the Bank of Canada describes it. If you spend more of your money on things that rose faster, such as rent or gasoline, your own costs rose faster than the calculator shows.
To see what rising prices do to money sitting in a bank account, read how inflation shrinks your savings, or use the rule of 72 to estimate how fast prices double. Our guide to inflation explains the bigger picture.
Update log
- : Calculator created with US prices to September 2026 and Canadian prices to August 2026.
- : Latest figures added: US September 2026, Canada September 2026. The figures on this page update with each official release.
Have a question about this article?
Ask us privately. We read every question, reply by email, and the best ones become new answers on the site.
Ask a questionResearched from the official sources linked in this article, drafted and fact-checked by the Understand Your Economy editorial team on October 16, 2026.
This article is general educational information, not personalised financial, investment, tax or legal advice. Consider speaking with a qualified professional about your own situation.
No paid links in this article.
Spotted an error? Tell us and we will correct it.